米国EIA(Energy Information Administration;エネルギー情報局)が10月5日付けで発表した “U.S. Energy-Related Carbon Dioxide Emissions, 2016” によると、2016年での米国のエネルギー関連CO2排出量は、GDP(国内総生産)が前年比1.5%増だったにもかかわらず、前年比1.7%減だったとの由。
その理由には、
①炭素強度(エネルギー消費量当たりのCO2排出量)の1.7%減
②エネルギー強度(GDP当たりのエネルギー消費量)の1.4%減 が含まれるが、これらを総合すると、GDP当たりのCO2排出量は3.1%減となる。
過去10年間のうちCO2排出量が減った年は6回あり、2016年のエネルギー関連CO2排出量は対2005年比で14%減となった。
《原文より抜粋》
Energy‐related carbon dioxide (CO2) emissions decreased by 89 million metric tons(MMmt), from 5,259 MMmt in 2015 to 5,170 MMmt in 2016. Although real gross domestic product (GDP) increased 1.5% over that period, other factors contributing to energy related CO2 emissions more than offset the growth in GDP, leading to a 1.7% decline in energy-related CO2.
These factors include the following:
・A decline in the carbon intensity of the energy supply (CO2/British thermal units [Btu]) of 1.7%
・A 1.4% decline in energy intensity (Btu/GDP) Combining these two factors, the overall carbon intensity of the economy (CO2/GDP) declined by 3.1%. Emissions have declined in 6 out of the past 10 years, and energy‐related CO2 emissionsin 2016 were 823 MMmt (14%) below 2005 levels.

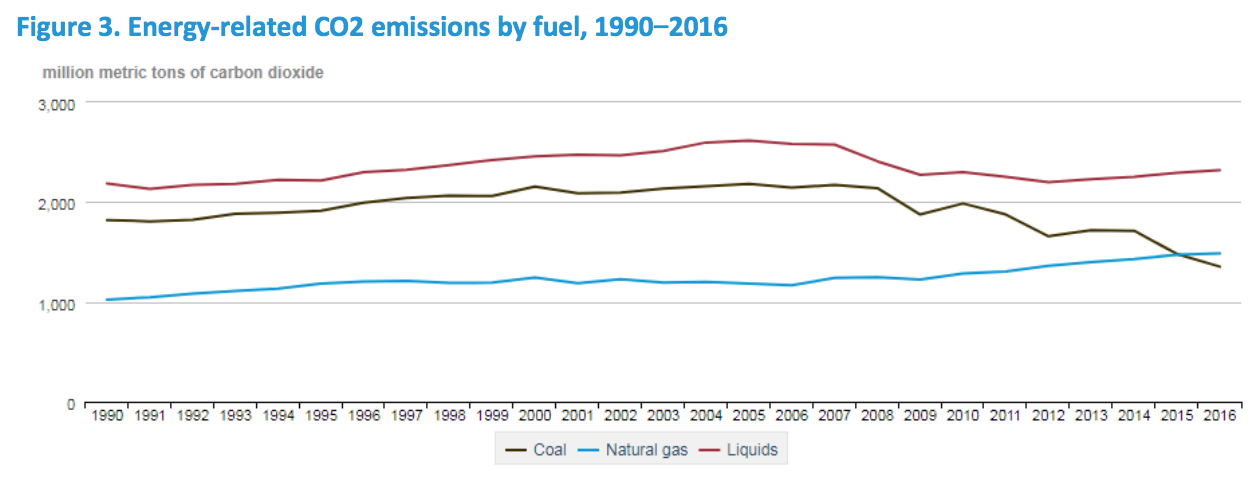
2007〜09年に景気後退が始って以来、石炭由来CO2排出量も減少。それにより、米国のエネルギー消費全体の炭素強度を低下させ、CO2排出量は景気後退以前の水準未満に抑えられた。
天然ガス由来CO2排出量は、2009年以降増えてきた。電力部門では、天然ガスの割合が増えるにつれて石炭の割合が減り、石炭由来CO2排出量の一部を相殺。
2016年、天然ガス由来CO2排出量は、石炭由来CO2排出量を上回った。だが、天然ガスは石炭と同じCO2排出量でより多くのエネルギーを生産するので、2016年は結局、天然ガス消費増は総CO2排出量の減少に寄与。
・Since the beginning of the 2007–09 recession, coal CO2 emissions have also generally declined. The decline in coal CO2 emissions has contributed to a lower overall carbon intensity of U.S. energy consumption and kept emissions below pre-recession levels.
・Natural gas CO2 emissions have increased every year since 2009. The natural gas share of electricity generation has grown as the coal share declined, partially offsetting the decline in energy-related CO2 emissions from coal. Natural gas CO2 emissions surpassed those from coal in 2016. However, because natural gas produces more energy for the same amount of emissions as coal, growth in natural gas consumption contributed to the overall 2016 decline in total emissions.
2005年以降、石炭火力発電の高効率化や、天然ガスコンバインドサイクル発電への転換、特に風力と太陽光などnonCO2電源の導入増により、電力部門での炭素強度は低下した。
2005年から2016年にかけて、電力量は約1%増えたにもかかわらず、関連CO2排出量は24%減った。その間、化石燃料による発電量は約9%減り、非化石燃料(nonCO2電源)による発電量は25%増えた。
Two basic factors contributed to lower electricity generation carbon intensity (CO2/kilowatthour) since 2005: substitution of coal-fired generation with the less-carbon-intensive and more efficient combined-cycle natural gas-fired generation, and growth in non-carbon electricity generation, especially wind and solar.
・Although total electricity generation use grew by about 1% from 2005 to 2016, related CO2 emissions fell by 24% over that period.
・From 2005 to 2016, fossil-fuel electricity generation declined by about 9%, while non-fossil (non-carbon) electricity generation rose by 25%.

2016年も、石炭火力発電量は減り、非化石燃料発電量と天然ガス火力発電量は増え続けた。
・石炭の割合は 1990年53% → 2016年30% にまで下がった。
・天然ガスの割合は 1990年12% → 2012年30% → 2016年34% にまで上がった。
・原子力と再生可能エネルギーを含む非化石燃料の割合は2016年35%で、石炭と天然ガスのいずれよりも上回った。
The trend of declining coal‐fired electricity generation and increasing non‐fossil fuel and natural gas‐fired generation continued in 2016.
・Coal's share of total electricity generation fell from 53% in 1990 to 30% in 2016.
・The natural gas share of electricity generation grew from approximately 12% in 1990 to 30% in 2012 and to 34% in 2016.
・The non-fossil fuel electricity generation share (35%), including both nuclear and renewables, exceeded that of both coal and natural gas in 2016.

原子力は依然として非化石電源の大宗を占めるが、2008年以降の風力・太陽光の導入増も電力部門の炭素強度の低下に寄与。
2016年に原子力発電量は増えたが、非化石電源に占める原子力の割合は、2001年に73%に達して以来、減少傾向にある。歴史的に最大の再エネ電源である水力も、非化石電源に占める割合は、1997年34%→ 2016年19% に減った。
2016年、風力・太陽光の合計で非化石電源の約20%になり、水力をわずかに上回った。バイオマスなど他の再エネは、2001年以降、非化石発電の約6%の水準を維持。
Although nuclear power remains the dominant source of non‐fossil electricity generation, growth in wind and solar generation since 2008 has also contributed to a decline in the carbon intensity of electricity generation.
・Althought nuclear generation increased in 2016, the nuclear share of non‐fossil electricity generation has generally declined since reaching 73% in 2001.
・Hydropower, which historically has been the largest source of renewable electricity generation, has also lost share, falling from 34% of non‐fossil electricity generation in 1997 to 19% in 2016.
・Wind and solar (combined) accounted for about 20% of non‐fossil electricity generation in 2016 and slightly exceeded hydropower after rising from less than 1% in 2000 to 2% in 2006.
・Other renewables, such as biomass, have remained flat at about a 6% share of non‐fossil electricity generation since 2001.

以上、2016年までの米国エネルギー事情について、電源構成、CO2排出量、GDPなどの視点を加味しながら概観してみた。
CO2排出量の抑制・削減は世界的にも急務ではあるが、それを実現させつつGDPを成長させることはできるという話。
今後更にCO2制約が高まっていけば、世界全体として、石炭から天然ガスへの転換と、非化石電源(原子力・再エネ)の新規導入が進むことが見込まれる。
日本としては、天然ガス(LNG)の調達を安定的に確保できるかが大きな政策課題。世界的に天然ガス需要が高まっていけば、日本の調達リスクが高まるのは必然。
日本が当面、原子力と再エネの導入を継続していく必要性は、そういう点からも頷ける。
(社会保障経済研究所 代表 石川 和男 Twitter@kazuo_ishikawa)